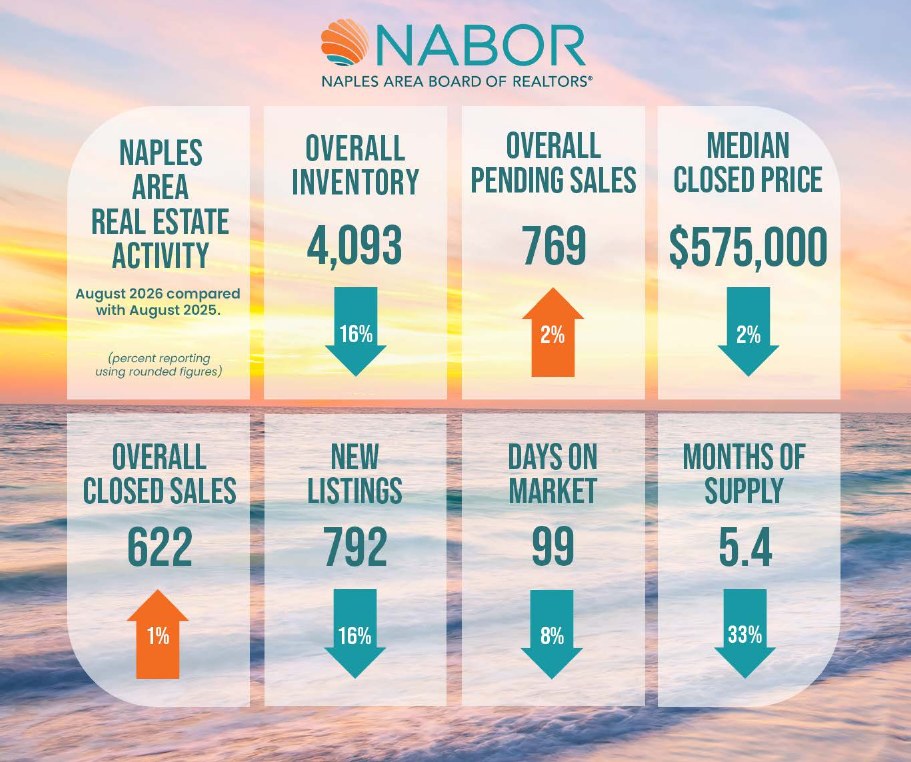
In August 2026, the Naples housing market moved in a different direction from the rest of the country. Closed sales in Naples rose 1.1% compared with August 2025, while national existing-home sales slipped 1.2%. The number of homes for sale in Naples dropped 16.3% to 4,093, while national inventory grew 5.9%. Prices in Naples held roughly steady at a median of $575,000, and the national median rose 1.6% to $429,100. In short, Naples is selling slightly more homes from a shrinking pool of listings, while much of the country is seeing the opposite.
What do the numbers look like side by side?
Here is the August 2026 snapshot, with each figure compared with August 2025.
| August 2026 vs. August 2025 | Naples area (NABOR) | United States |
|---|---|---|
| Closed sales | 622 (+1.1%) | 3.98M annual rate (−1.2%) |
| Homes for sale | 4,093 (−16.3%) | 1.62M (+5.9%) |
| Months of supply | 5.4 (from 8.1) | 4.9 (from 4.6) |
| Median price | $575,000 (−1.7%) | $429,100 (+1.6%) |
| New listings | 792 (−15.5%) | Essentially flat (−0.1%) |
| Time on market | 99 days average (from 107) | 31 days median (unchanged) |
Naples figures cover Collier County, excluding Marco Island. National sales, inventory, price, supply and time-on-market figures are from NAR; national new listings are from Realtor.com. Time on market is measured differently in each report, so compare the direction, not the raw numbers.
Are more homes selling in Naples than last year?
Slightly, and it has been a steady pattern. The Naples Area Board of REALTORS® reported 622 closed sales in August, up from 615, and 769 homes went under contract, up 1.9%. Nick Bobzien of Downing-Frye Realty pointed out that Naples has now posted 15 straight months of closed sales above the same month the year before. For the year so far, pending sales are up 21.7% and total sales are up 16.2%.
Nationally, the picture is softer. NAR reported existing-home sales at a 3.98 million annual rate in August, down 2.0% from July and 1.2% from a year earlier. NAR's chief economist tied the dip to mortgage rates, which move in the opposite direction from sales.
Why is Naples inventory shrinking while the national inventory grows?
New listings are the main reason. Sellers listed 792 homes in Naples in August, down 15.5% from 937 a year ago, while buyers kept buying. Total inventory fell 16.3%. Nationally, new listings were flat compared with last year and inventory crept up 5.9%.
Here is the part that is easy to miss. Naples still has slightly more supply than the national average, at 5.4 months versus 4.9 months nationally. The difference is the direction. A year ago Naples had 8.1 months of supply, and that number has dropped by a third. The nation went the other way, from 4.6 to 4.9. So Naples is tightening quickly from a more generous starting point, and it has not become a scarcity market.
What are prices doing in Naples?
Roughly holding. The Naples median closed price was $575,000 in August, down 1.7% from $585,000. Since January the overall median has moved only 0.8%. Single-family homes sold at a median of $717,500 (down 1.7%), and condominiums at $417,500 (up 2.7% for the month, though still down 4.3% for the year so far). Year to date, the single-family median is up 4.1%.
Appraiser Cindy Carroll noted in the NABOR report that falling inventory usually pushes values up, and that has not happened yet in Naples. Nationally, the median existing-home price rose 1.6% to $429,100.
How fast are homes selling?
Naples homes averaged 99 days on market in August, down 7.5% from 107 days a year earlier, and price decreases fell 30.2% to 790 from 1,132. Nationally, NAR's median time on market was 31 days, unchanged from last year. These two figures are measured differently and a luxury, seasonal market like Naples will always run longer than a national median, so the useful takeaway is the trend: Naples is getting faster, and fewer sellers are having to cut their price.
A shrinking inventory and steady prices is an unusual combination. It usually means sellers who price correctly are being rewarded, and sellers who start too high are still waiting.
What does this mean if you're buying in Naples?
You have more choices than a tight market would give you, and prices have not run away. But the pool of homes to choose from is getting smaller, month after month. Local brokers quoted in the report expect inventory to keep falling if new listings stay low, and some believe that will pull buyers off the sidelines before the end of the year. That is their read, not a guarantee, and it varies a lot by community and price range.
What does this mean if you're selling in Naples?
Homes that are priced right are selling faster, and price reductions are down sharply. The pattern in the report is that sellers who start high sit longer. If you are weighing a sale, the winter season is when the seasonal buyers return, and the numbers going into it look better than they did a year ago.
How would we use these numbers if you called us?
We would start by setting the headline aside. A countywide median does not buy or sell a house. Your street, your price range and your timing do. So we look at how many comparable homes are competing with yours, or with the one you want, how long they have sat, and how many have already cut their price. Then we check whether your corner of Southwest Florida is telling the same story as Naples, because it can be a different one. For a buyer, that shows where there is real room to negotiate and where there is not. For a seller, it shows the price that gets a showing in the first week instead of the eighth. That is the work we do before any offer or listing goes out, and it is the part that never shows up in a monthly report.
What these numbers do not tell you
The NABOR report covers Naples and Collier County, excluding Marco Island. Bonita Springs and Estero sit mostly in Lee County and are reported separately, and individual communities, gated neighborhoods and price bands can differ a lot from the county average. National figures come from NAR and Realtor.com and use different methods, which is why we compared direction and trend. If you would like the numbers for your specific community, we can pull them.
Frequently asked questions
Is the Naples housing market stronger than the national market right now?
On the August 2026 numbers, Naples is moving differently from the nation. Closed sales rose 1.1% year over year in Naples (622 vs. 615) while national existing-home sales fell 1.2%. Naples inventory dropped 16.3% to 4,093 homes while U.S. inventory rose 5.9%. Naples prices were about flat (median $575,000, down 1.7%) while the national median rose 1.6% to $429,100.
Is it a good time to buy a home in Naples, FL?
Buyers in Naples have more choices than a tight market would give them, and the August 2026 median closed price of $575,000 is only 0.8% below where it started the year. Inventory is falling and sales have risen for 15 straight months, so the window of extra choice is narrowing. A local agent can compare your specific community and price range rather than the countywide average.
Do these Naples numbers apply to Bonita Springs and Estero?
Not directly. The NABOR report covers Collier County (excluding Marco Island). Bonita Springs and Estero sit mostly in Lee County and are reported separately, and individual communities can look different from the county average. Ask The Borg Group for numbers on your specific community.
Sources: Naples Area Board of REALTORS® (NABOR) August 2026 Market Report, released September 25, 2026; NAR Existing-Home Sales Report, August 2026; Realtor.com August 2026 Housing Report.